Overview economy
Economic development, value added, sectoral structure and company structure. Here you can find the most important macroeconomic figures and charts for the business location Basel-Stadt.
Economy
| 2011 | 2016 | 2019 | 2020 | 2021 | |
|---|---|---|---|---|---|
| nominal gross value added (CHF billion) |
32.5 | 37.0 | 39.7 | 37.9 | 38.5 |
| nominal GDP (CHF per capita, in thousand) |
171.2 | 185.6 | 198.4 | 187.8 | 190.3 |
| growth in real GDP per capita |
5.9 % | 7.1 % | 2.0 % | -2.0 % | 3.4 % |
| inflation | 0.3 % | -0.2 % | 0.5 % | -0.6 % | 0.6 % |
Source: BAK Economics, Statistical Office of the Canton of Basel-Stadt.
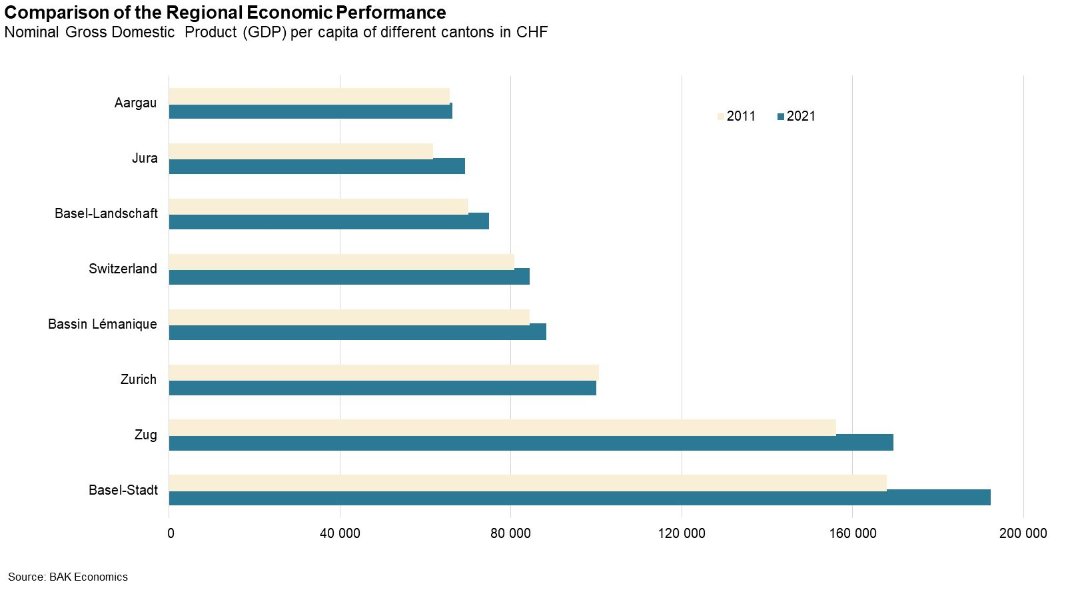
Regional economic performance
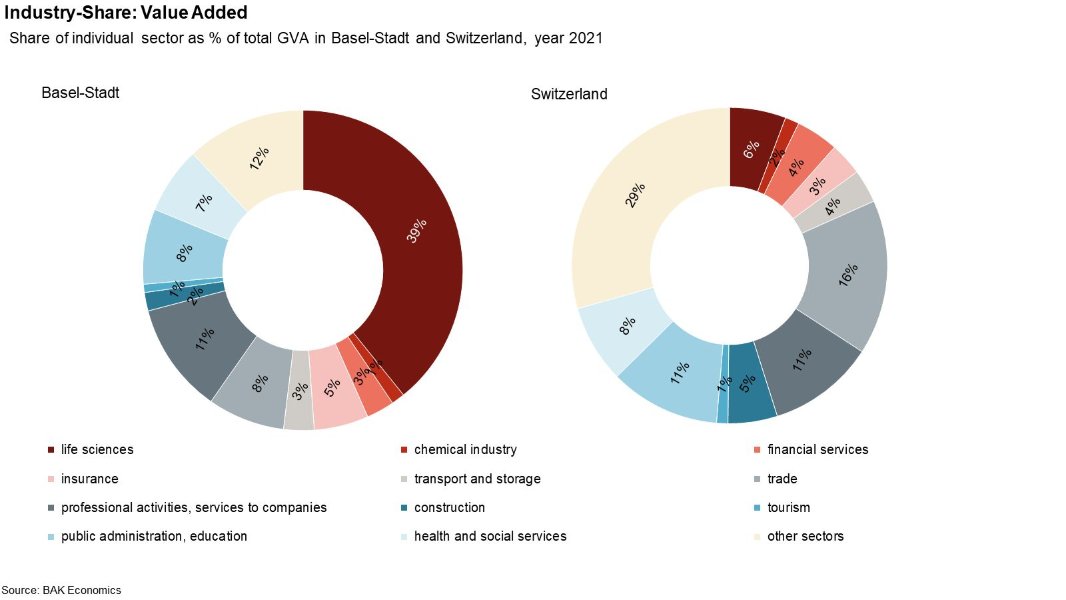
Industry-Share
Sectoral concentration and productivity
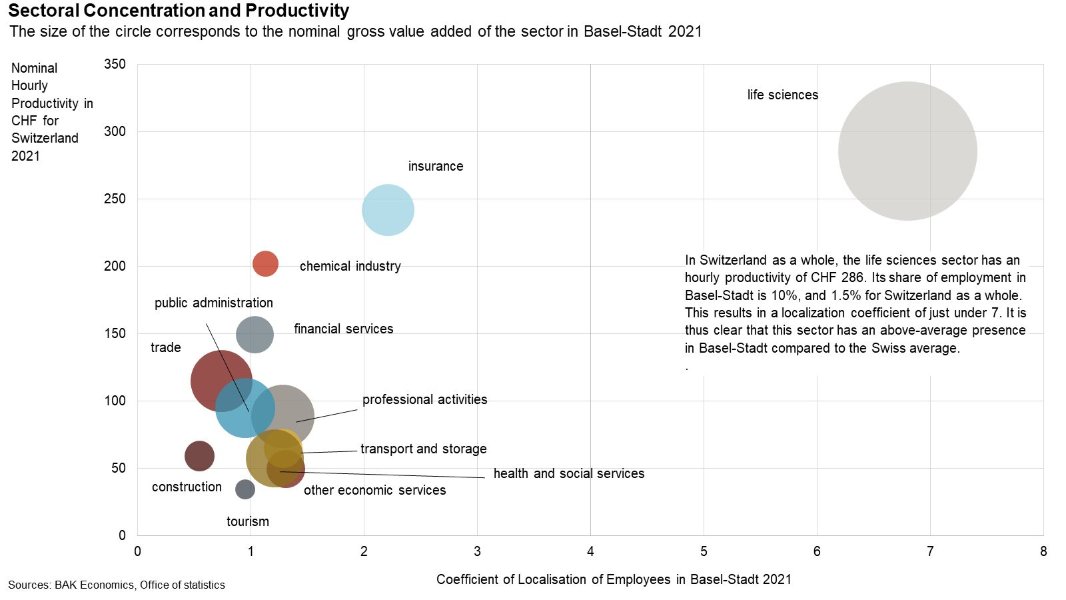
Explanation: The coefficient of localisation is created to analyse the regional specialisations of the industries. It compares the ratio of employed persons of the industry with the average ratio of the sector for total employment. A value higher than 1 indicates that in Basel-Stadt the sector is represented higher than the Swiss average.
Business structure
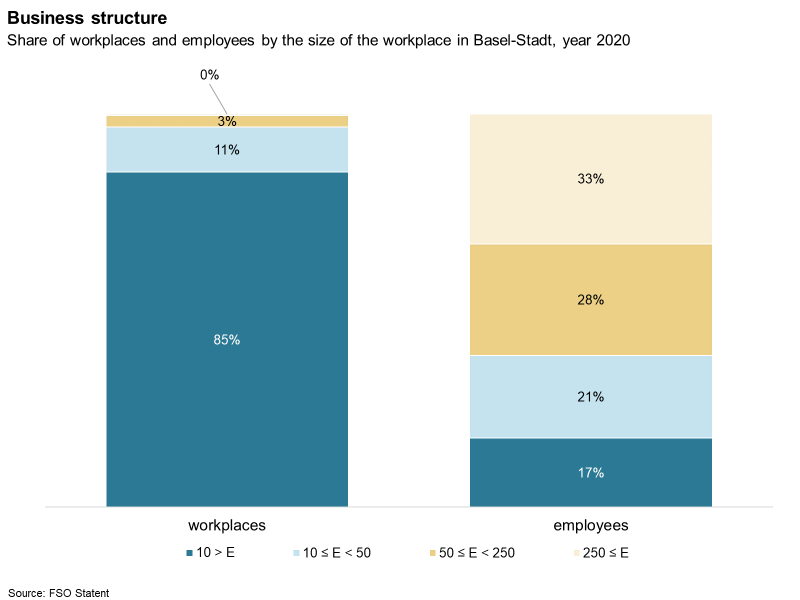
One third of all employees in the canton of Basel-Stadt worked in places with more than 250 employees in 2020, although Basel-Stadt has the lowest number of workplaces of this size. Most businesses have nine employees or even fewer than that.
Foreign Trade
Who were the most important trading partners of Basel-Stadt’s economy in 2022? Germany ranked first for imports in 2022, just as it has for the past five years. Most exports went to the United States, as in the previous year. Foreign trade in Basel-Stadt is also strongly influenced by the local economic structure: pharmaceutical products account for around 82% of exports and 78% of imports. A graphical presentation of the most important trading partners of the Canton of Basel-Stadt can be found under the following link:
Foreign Trade Figures Basel-Stadt 2022